Ethereum just smashed through $4K and is now holding around $4.2K, its highest level since late 2024. The market mood is buzzing. Memes are back on the timeline. Traders are asking the question: is it Pepe time?
PEPE price today is trading near $0.00001233 after a sharp two-day rally that erased weeks of sluggishness. The surge came after a clean breakout above $0.00001130, which is now acting as a support zone. Bulls are eyeing higher levels as Ethereum leads the charge in this pump.
Study our series of trading guides
What’s Happening With PEPE’s Price?
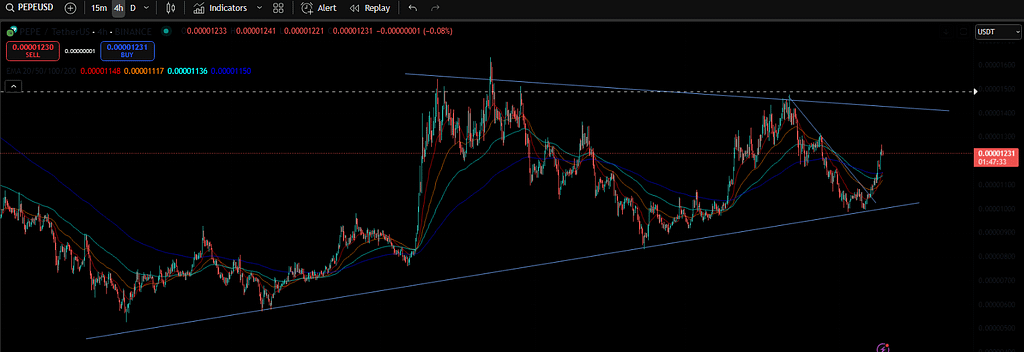
On the 4-hour chart, PEPE has broken a stubborn descending trendline that capped rallies since late July. The breakout was confirmed by strong green candles smashing through $0.00001130 and $0.00001200.
Price is now approaching the next resistance between $0.00001320 and $0.00001350. If that area breaks, momentum could accelerate fast.
All key EMAs (20/50/100/200) are stacked in a bullish alignment, with the 20 EMA at $0.00001129 acting as support. Bollinger Bands are expanding sharply, with price hugging the upper band at $0.00001233. This signals strong buying pressure and heightened volatility.
Technical Picture and Momentum
On the daily chart, PEPE is inside a large symmetrical triangle. The rally is pressing toward the upper boundary. A breakout above $0.00001350 would confirm a bullish resolution and could spark a run toward new local highs.
On-chain data shows net inflows of about $511,970 in the past 24 hours. This shift from net outflows to inflows hints at renewed accumulation.
The 30-minute RSI is near 70, showing overbought territory but no major bearish divergence. MACD remains bullish with momentum building. The 4-hour Supertrend flipped green at $0.00001130, reinforcing the breakout bias.
Related: The war of meme launchpads is on.
Key Indicator Signals and Volatility Outlook
Bollinger Band expansion plus bullish EMA alignment points to elevated volatility ahead. The breakout above $0.00001200 came with a spike in trading volume, suggesting real buying interest instead of a low-liquidity pump.
The daily Money Flow Index (MFI) sits near 45.9, leaving room for more upside before hitting overbought extremes. That means PEPE could still push higher if Ethereum’s rally continues.
Short-Term PEPE Price Prediction (24H)
In the next 24 hours, PEPE might test the $0.00001320–$0.00001350 resistance zone. A solid close above $0.00001350 with heavy volume could pave the way to $0.00001450, and maybe even $0.00001550.
If sellers step in, first support is $0.00001200, then $0.00001130. A drop below $0.00001130 would break the short-term bullish structure and could send price back toward $0.00001050–$0.00000985.

Medium-Term Speculation: Can Memes Ride ETH’s Momentum?
Ethereum leading the market often gives meme coins extra fuel. PEPE, as one of the top Ethereum memes, tends to follow ETH’s big moves. If ETH keeps pushing toward $4.5K or beyond, it’s hard to imagine PEPE not catching a bid.
The psychological factor also plays a role. Traders love chasing memes during strong market upswings. If social media hype picks up alongside the technical breakout, PEPE could see accelerated gains.
Support Our Work
If you found this helpful, consider signing up on BloFin (Non-KYC) or Bybit using our referral links. Your support keeps this content free and flowing.
Final Words
The setup looks promising for PEPE in the short term. Breakout structure, bullish EMAs, improving inflows, and Ethereum strength all point to an upward bias.
Of course, meme coins are volatile. Price swings can be brutal. That’s why timing is key when asking, “Pepe time?” For now, bulls are in control — but the next 48 hours will be critical for confirming if this rally has real legs.
If you enjoyed this blog, you may want to check out our blog about $DOGE to 1 dollar.
As always, don’t forget to claim your bonus below on Bybit. See you next time!