")
")
XRP price is still moving sideways without much direction, stuck inside the same range it’s been in for weeks, it’s currently trading at $2.11 and has been down 3.21% in the past day.
After trying and failing to break through the mid-range resistance near $2.21, the price has pulled back again. Sellers are gaining some ground, and the momentum looks weak heading into today’s session.
With XRP price holding between $1.90 and $2.30, the token hasn’t made a decisive move yet. Let’s break down where things stand.
📅 What We Got Right Yesterday
In yesterday’s prediction, we pointed out that XRP was likely to stall around $2.20–$2.22 if it couldn’t break through on strong volume.
That’s exactly what happened. XRP Price touched $2.21 and got rejected, which formed another red candle and slipped back below the mid-range.
We also mentioned that unless volume increased, XRP would stay stuck between $2.00 and $2.30 and so far, that’s been the case. The market is quiet, and momentum is fading again.
📊 XRP Daily Overview (June 27)
- Current Price: $2.1096
- 24h Change: –3.49%
- Volume: Still on the low side
XRP price is drifting lower after getting rejected at mid-range resistance. Buyers didn’t have enough strength to push through $2.22, and now the price is heading back toward the middle of the range. It’s still holding above $2.00, but the overall structure is getting weaker.
🔍 What the XRP Chart Is Saying
The XRP chart shows a sideways channel between $1.90 and $2.30, and XRP has stayed inside it for most of June.
That bounce off $1.95 looked promising, but it ran out of steam quickly. The latest rejection near $2.21 could end up being a lower high if the price starts sliding again.
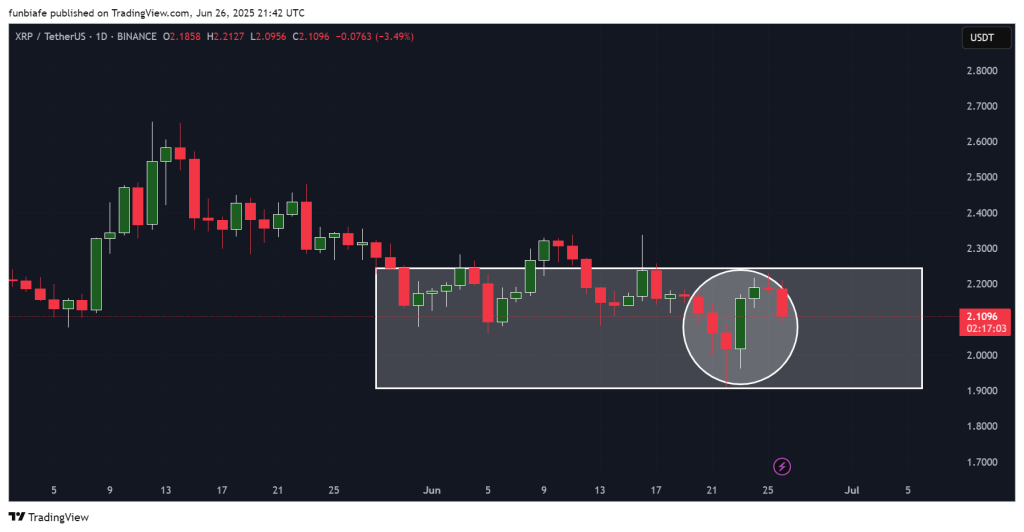
Candles are small, volume is light, and the market feels indecisive. Unless XRP price breaks above $2.30 or drops below $2.00, this chop is likely to continue.
📈 Technical Indicators (Daily Timeframe)
| Indicator | Value | What It Means |
| MACD (12,26) | –0.018 | Bearish crossover, momentum still weak |
| ADX (14) | 43.11 | Strong trend strength, favors the downside |
| CCI (14) | –68.98 | Bearish pressure, not quite oversold |
| RSI (14) | 34.49 | Nearing oversold but no bounce yet |
| ROC | –3.53 | Price dropped compared to 2 weeks ago |
| Bull/Bear Power | –0.0253 | Bears still have the edge |
Summary: All the indicators are still pointing to a bearish setup for now. The trend looks pretty weak, and there’s no real sign of a reversal on the daily chart yet.
🔮 What Could Happen Next
Bullish Case:
If XRP can finally break above $2.30 with strong volume, it might run toward $2.50. That hasn’t happened yet.
Neutral Case:
If XRP price keeps ranging between $2.00 and $2.30, we’ll likely see more sideways movement until something changes.
Bearish Case:
If XRP drops below $2.00, it could start heading back toward $1.85 or maybe even down to $1.75 if selling picks up.
Read Also: Ripple Flips the Switch: XRP and RLUSD Now Live at Global Retail Giants
🧠 Final Thoughts
XRP price is still stuck in a choppy range, and the failed move above $2.20 shows that bulls don’t have control right now. Indicators are still leaning bearish, and sellers are gaining confidence.
Unless we see a major shift in momentum, XRP will likely keep bouncing between $2.00 and $2.30. Traders are watching closely for a clear move outside that range to figure out where things are headed next.
Subscribe to our YouTube channel for daily crypto updates, market insights, and expert analysis.


